
Ribbon Auction Performance Analysis

The first Ribbon auction for WETH call options occurred on the 2nd of April 2021, where 4.68 oTokens sold for 0.0052 ETH per oToken. Fast forward to the 1st of April 2022, 39,616 oTokens were auctioned on the Ribbon ETH Auctions and cleared at 0.0047 WETH per oToken.
The aforementioned figures illustrate well the fulgurant increase in interest from investors looking for yield in Decentralized Option Vaults (DOVs). The total value locked in such vaults currently amounts to $164 million for Ribbon and to roughly $270 million across protocols offering similar products. In a growing crypto derivatives market, still dominated by retail flows, we may wonder how the fast rise of Decentralized Option Vaults, their current execution and weekly flow impact the yield they generate.
In this article, we will first analyze the current landscape of Decentralized Options Vaults and how these flows impact the crypto derivatives market. Then, we will investigate how efficient is the current Ribbon’s auctions execution mechanism by comparing past auctions clearing prices to Deribit prices. Finally, we will suggest and discuss new execution mechanisms and try to quantify the additional potential yield generated for users.
Main Flows and Structural Dislocation in Crypto Derivatives Markets
Historically, we have observed three main flows within the crypto derivatives market. First, call buying to get leveraged upside or put buying to get downside protection. Second, selling out-of-the-money call and put options and taking advantage of the high volatility regime of crypto assets to generate yield. Trades like covered calls, puts or strangles selling were implemented on a discretionary basis since 2019 on centralized exchanges or over the counter (OTC). In 2021, such trades started to be implemented systematically through Decentralised Option Vaults (“DOVs”). The timing was great as implied volatility remained high while many players in the discretionary space had vanished due to spot going parabolic and call sellers having to cover their shorts as a result.

Source: https://defillama.com/protocol/ribbon-finance/all/USD. Data as of 8 June 2022.

Deribit is the current leading centralised exchange for crypto derivatives, accounting for ~95% of the volume traded. (https://www.deribit.com/)
As can be observed on the chart above, the total value locked in Ribbon vaults has been growing steadily throughout 2021 and continues to grow in dollar terms in 2022 despite ETH/USD currently being down ~62.8% since all-time highs (as of 8th of June 2022). This growth resulted in the largest recurrent options flows now coming from Decentralized Option Vaults. The two current most popular strategies are covered calls and put selling. In short, these strategies systematically sell weekly 10 delta call and put options. Market makers take the other side of the trade to express directional views on delta or volatility by hedging in the futures or perpetual futures markets.
This results in compressing the implied volatility for the options with the aforementioned maturities and strikes each week. We see two reasons for this phenomenon:
On the one-hand, as Ribbon publishes the quantity of options to be sold, and their delta and expiry are known, some market makers participating in the Ribbon auctions sell the relevant options on exchanges ahead of the auction hoping to buy back the risk they sold cheaper through the auctions. As a result, this dampens the implied volatility ahead of the auctions.
On the other hand, there is generally low natural demand for such out-of-the money options from investors and it can be difficult to flip the risk on a centralized exchange such as Deribit for such size for market makers. The share of market participants using the auctions to take directional views is relatively low and thus, as the supply exceeds the natural demand, this creates a structural imbalance between buyers and sellers ultimately resulting in the implied volatility trading at a discount. We have seen above that there is historically a greater demand for calls than puts and as such, we expect this imbalance to be more important for the latter.
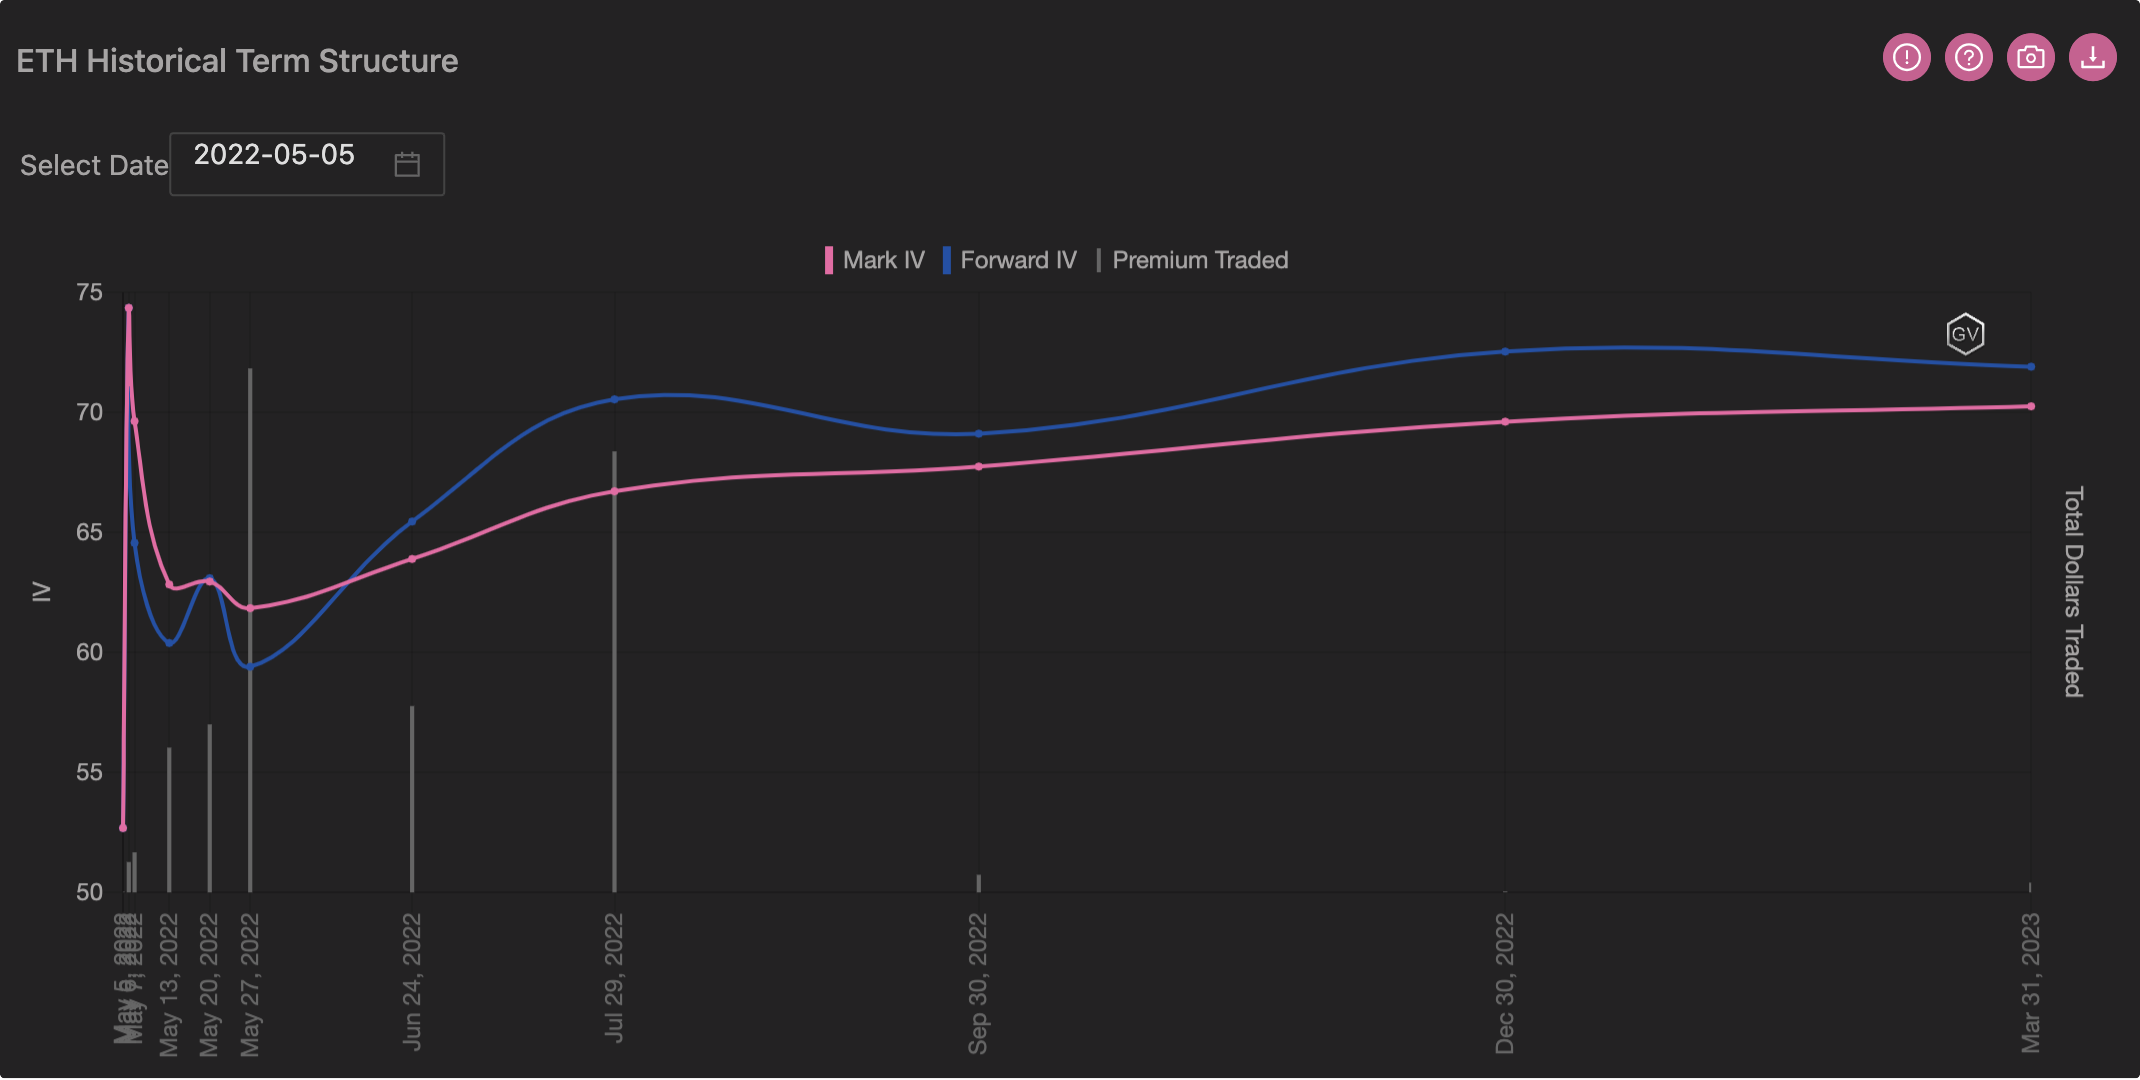
We can observe this impact by looking at both the term structure (implied volatility as a function of expiries) and the skew (implied volatility as a function of the strikes) on the day of the auctions. We take the auction of the 6th of May 2022 as an example where the options sold were the ETH-13May22-2400-P and the ETH-13May22-3000-C.

Source: Genesis Volatility. Data as of 12 May 2022.

Source: Genesis Volatility. Data as of 12 May 2022.
We can clearly see on the above how the implied vol is dropping on this day while the premium traded rose at the same time. The effect for the 3000 calls is less prominent but still visible.
Source: Genesis Volatility. Data as of 12 May 2022.

Source: Genesis Volatility. Data as of 12 May 2022.
While the term structure charts above represent the at-the-money options, we can observe that the implied volatility for the 13 May2022 drops 3 volatility points between the day prior to the auction and the auction day.
Assessment of current auction mechanism
The aforementioned imbalance between supply and demand leads to dislocations in crypto derivatives markets. Namely, the implied volatility closer to the auction time trades at a discount compared to the historical implied volatility for options with similar delta and time to expiry. Let us now turn our attention to the past auctions clearing prices and compare them with the Deribit prices around this time to assess the execution of Ribbon’s auctions.
To do so, we compare the implied volatility of the clearing prices to the volume weighted average implied volatility of the trades for:
10 delta calls and puts for the same expiry and underlying, within a 24-hour window around the auction time. Here, it is worth noting that we are comparing Ribbon’s clearing prices with the clearing prices on Deribit for options with the same delta, thus, assuming that the volatility skew remains unchanged with delta.
Fixed strike call and puts for the same expiry and underlying, within a 24-hour window around the auction time. Conversely, here, it is worth noting that we are comparing Ribbon’s clearing prices with the clearing prices on Deribit for options with the same strike, thus, assuming the volatility skew remains unchanged with strike.
The actual delta computed at the end of the auction for call and puts for the same expiry and underlying, within a 24-hour window around the auction time.
It is crucial to note that the figures below are only indicative. On top of the aforementioned assumptions, the implied volatility difference we are observing is also due to the passage of time: as time passes, implied volatility goes down (assuming all other parameters are unchanged). Additionally, as we are trying to evaluate the selling pressure coming from market makers, we assume that they would sell the strikes closest to 10 delta, which not necessarily perfectly align with our selected strikes/delta at the time of the auction.
Puts
We only consider sell trades as the bid-offer spread can be quite volatile and thus, taking it into account would yield inaccurate results. We filter auctions where we are seeing more than 20 trades on Deribit within the 24 hours window surrounding the auction and any outliers where the absolute implied volatility difference is greater than 10 volatility points.
10 Delta Puts

Source: Deribit, GVOL and Ribbon Finance. Data as of the 17th of May 2022. Data used is from 13Jan2022 to 10 May 2022.
The volume weighted average implied volatility for 10 delta puts on Deribit around the auction time is 2.34 volatility points lower compared to Ribbon’s clearing implied volatility. However, it is worth noting that the delta computed at the end of the auctions for the auctions where the difference is the most negative is ranging between -6% and -7.5%. Indeed, the delta for a put becomes more negative as spot decreases and usually volatility goes up, thus, resulting in a larger difference compared to 10 delta puts.
Fixed Strike Puts

Source: Deribit, GVOL and Ribbon Finance. Data as of the 17th of May 2022. Data used is from 13 Jan 2022 to 10 May 2022.
For fixed strike puts, the volume weighted average implied volatility on Deribit around the auction time is 1.72 volatility points higher compared to Ribbon’s clearing implied volatility.
Fixed Delta Puts

Source: Deribit, GVOL and Ribbon Finance. Data as of the 17th of May 2022. Data used is from 13Jan2022 to 10 May 2022.
For fixed delta puts using the delta computed at the end of the auction, the volume weighted average implied volatility for on Deribit around the auction time is 2.82 volatility point higher compared to Ribbon’s clearing implied volatility.
Overall, for comparable ETH put options, Ribbon auctions are clearing between 1.72 and 2.82 volatility points cheaper than on exchange.
It is worth noting that in TradFi, we observe large flows from institutional investors buying puts on large indices for protection in order to meet some risk and regulatory constraints. One hypothesis for such a difference could also be that as institutional money has not reached the market yet, very few players are looking to buy outright tail protection.
Calls
10 Delta Calls

Source: Deribit, GVOL and Ribbon Finance. Data as of the 17th of May 2022. Data used is from 13 Jan 2022 to 10 May 2022.
The volume weighted average implied volatility for 10 delta calls on Deribit around the auction time is 2 volatility points greater compared to Ribbon’s clearing implied volatility. However, it is worth noting that the delta computed at the end of the auctions for the auctions where the difference is the most negative is ranging between 4.5% and 14.38%.
Fixed Strike Calls

Source: Deribit, GVOL and Ribbon Finance. Data as of the 17th of May 2022. Data used is from 13 Jan 2022 to 10 May 2022.
For fixed strike calls, the volume weighted average implied volatility on Deribit around the auction time is 1.83 volatility points higher compared to Ribbon’s clearing implied volatility.
Fixed Delta Calls

Source: Deribit, GVOL and Ribbon Finance. Data as of the 17th of May 2022. Data used is from 13 Jan 2022 to 10 May 2022.
For fixed delta calls using the delta computed at the end of the auction, the volume weighted average implied volatility for on Deribit around the auction time is 2.64 volatility point higher compared to Ribbon’s clearing implied volatility.
For ETH calls, on average, the Ribbon clearing price is between 1.83 to 2.64 volatility points lower than the volume weighted average implied volatility of trades within the 24-hour window around the auction time.
Potential improvements and Additional Yield Generated
Current Auction Setup
Currently, Ribbon auctions are conducted every Friday from 10:20 to 11:40 UTC, to align with expiries on centralized exchanges like Deribit, where the auction for each vault lasts 10 minutes. A Batch Auction mechanism is used. You can find more information about the latter here: https://gnosis-auction.eth.link/#/docs/batch-auctions#topAnchor.
On the 27th of May, the first Ribbon auction on Paradigm was conducted for the WBTC Covered Call vault. As a result, the full size was traded 6 bps above the Deribit screen at the time of the auction. We conducted the second Paradigm auction on the 4th of June, for the WBTC Covered Call vault and again cleared 6 bps better than the Deribit screen price at the same time.
As identified above, Ribbon auctions have traded historically at a 1.83 to 2.64 and 1.72 to 2.82 volatility points discount to the average price around the auctions for calls and puts respectively. Thus, the aim is to reduce the market impact from the options sold to obtain a better clearing price, which ultimately would result in greater yield for users. We also observed that the current auction time is too long. Indeed, as spot moves during this time interval, the minimum price and the strike are not necessarily the relevant anymore when bidders submit their bids, which usually happens within the last 2 minutes.
Potential Improvements
The key to designing a successful execution mechanism is to understand the bidders’ behaviors and objectives. Namely, we logically find that market makers will offer improved pricing if they are already axed, and if they can bid for the full size. As such, we believe that random time auctions would not necessarily be a solution since market makers would not be able to anticipate the flow and thus, would offer wider prices as a result. We also think that clearing bids as they come - similar to a traditional order book system, would result in market makers potentially “gaming” the system and worsen the execution.
Instead we prefer to conduct multiple blind, full size, and fixed auctions over a 24-hour window to spread out the volume of options sold. As market makers would not be able to see other participants bid but would need the size to cover their axes, they would be encouraged to show their best bid to clear the full size. We also think that spreading the size would reduce the market impact. The premium earned would be the volume weighted average of the options’ prices for each auction. Assuming we would be using a fixed strike throughout the time window and traded at the volume-weighted-average implied volatility (thus, the average traded delta could be different than 10%), the additional yield harvested on the put selling would have been approximately 1,829,285 USDC and 514 ETH for the put ETH selling vault and the ETH covered call vaults respectively.
The main drawback is the loss of theta as time to maturity would ultimately be reduced if an important portion of the options are sold after the current auction time. This would reduce the weekly yield generated. The second drawback could be that as spot moves throughout the time window, the strikes of the options sold could be different, or as mentioned previously, the average delta would differ from the 10% target.
Conclusion
In conclusion, DOVs have become a major flow in the crypto derivatives market which drives down the weekly implied volatility.
Then, regarding the ETH put-selling vault, Ribbon clearing implied volatility is on average between 1.83 to 2.64 volatility points below Deribit average and 1.72 to 2.82 volatility points for the ETH covered-call vaults. While this implied volatility discount would be considered substantial for traditional markets on options on liquid underlyers, one must take into account that the crypto options market is not yet mature and that not many market makers can bear to take such risk on the other side given the size. Indeed, the volume available traded on exchanges within the 24h time window represents on average 23% and 29% of the volume traded through the auctions for ETH puts and calls respectively.
We suggest changing the execution mode to fixed times and to split the size across multiple blind, full size auctions over a 24h window around the current auction time to approximate the volume weighted average implied volatility we are seeing on Deribit.
We believe that it would improve the clearing price and result in higher yield for users, as observed historically. This is particularly important because, since the risk profile of selling an option is asymmetric, systematically selling options can be justified only by the adequacy of the premium they generate.
Another way to potentially reduce the spread between Ribbon implied volatility and Deribit implied volatility would be to incentivize more users to participate in auctions and take the other side of the trade by offering risk-recycling vaults. For instance, to recycle the current vega, one may wonder if using the pre-auction IV as a good estimate of future realized volatility, would one make money by delta-hedging options purchased through Ribbon auctions?